You only get one chance to fly the line you choose to fly. But what if you could go back, and analyse the decision? Consider the alternatives? Compare with others? You can ... with a tracklog!
In this multi-part series, Flybubble team pilot Phil Clark explains how you can learn a lot from analysing your flight tracklogs. Part one explains how to view your flight data by getting it out of your instrument and on to your computer, uploading it to an online XC league, and downloading the Google Earth (GE) file. Part two explains how to get more out of your tracklogs with GE, understanding the different file types, and drawing lessons from from them. Part three looks at multi-coloured traces. Part four draws more tracklog lessons. Part five investigates ways to learn from others in competitions and XCs.
Flight Analysis 1: Viewing The Data
1. Get the IGC file
Many modern instruments have a GPS element to tell you where you are and where you are going. If the unit has logging capability it allows you to look back at where you have been and learn more about your flights. Once you start analysing your own flying you will start to look at the flights of others too and so your learning accelerates.
If you want to review your flight you'll need an IGC file from your device. This is a tamper-proof tracklog format established by the International Gliding Commission. Some instruments like the Naviter Oudie, Flymaster GPS SD, Syride SYS'Nav V3 produce this automatically so you can connect with a USB cable and drag and drop your flights from instrument to PC. Older instruments require the use of the free GPSdump software to download the raw tracklog and convert it to IGC format.
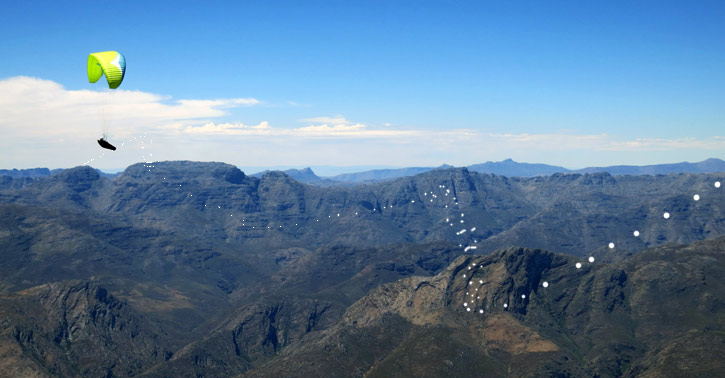
^ Tracklogs can give you inspiring ideas and new routes to follow
2. Upload it to an online XC League/Contest
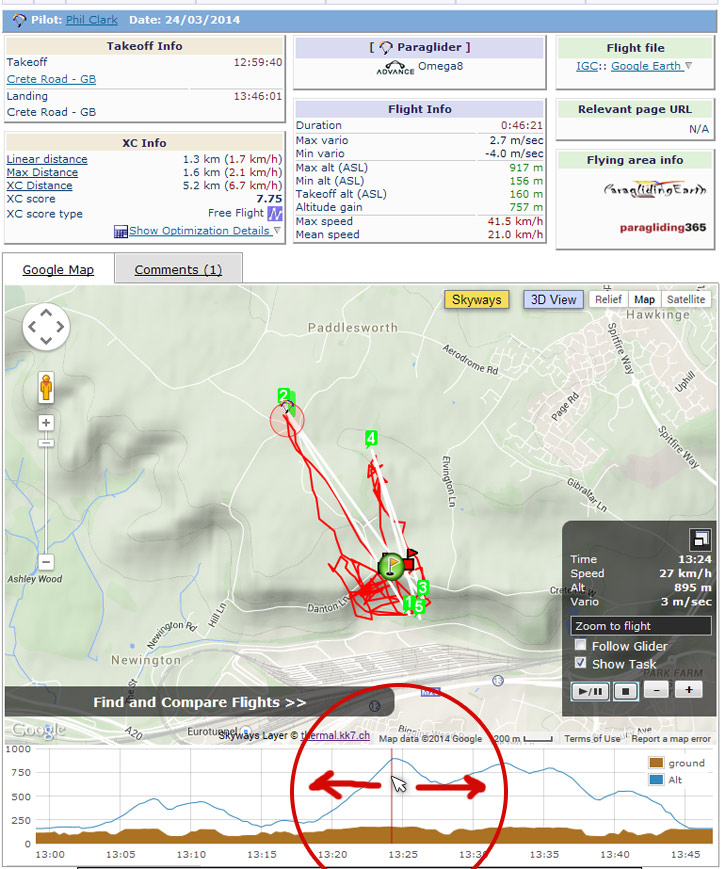
There are various online contests, one of which is Leonardo. Registering for an account is free. Once you have uploaded a flight (Main Menu>Submit Flight) click the green Display icon to see the details. You can move around the flight by panning your mouse across the altitude profile (see below). Tick the Follow Glider box to keep it centred on you when zoomed in, and the little Maximise Window icon to go fullscreen. By opening other flights posted on the same day you can compare your routes, choices, low saves and all the 'there I was' moments.
3. Download the Google Earth file
For a more detailed analysis grab the modified Flight File (top right) for Google Earth (use the most detailed version) and open it up. We’ll show you how to use this in Part Two.
Other options
For a visual fly-through, upload your file to Doarama.com and grab some popcorn. It’s a pretty way of reliving the flight or presenting an annotated story to friends but it has limited analysis value. Another, premium flight review tool is SeeYou from Naviter which offers visualisation with airspace, flight statistics, and allows you to load multiple tracklogs for side-by-side comparison. I can be useful but expensive and cumbersome, and more aimed at sailplane than freeflight pilots. You can view these tracks for free on an online contest website like XContest.
^ Analysing a record day on SeeYou
IGC file troubles?
Getting the first IGC file onto the computer is the biggest hurdle for many pilots. Most Mac & PC set-ups work simply, but some more recent Windows applications require you to make use of the desktop environment. If the instrument doesn’t show up when it's attached by the correct cable then the software driver might be missing. Download it from the instrument's manufacturer. If you're really stuck a club coach can often point you to someone technically minded and willing to help. Another great resource is a friend with the same instrument.
A tablet usually isn't capable of communicating with flight instruments. In this case you're better off with an instrument that feeds your tracklog directly to a server. Some units, like the Flymaster's GPS+ SD or Live SD (which have a SIM card installed) will send updates on position via the cell-phone network. This means the trace is automatically posted and available to view on any device with a web browser (like a smart phone or tablet). You simply go flying and then look at your flight afterwards on somewhere like Livetrack24 (not brand specific) or Flymaster Livetracking (Flymaster brand only).
Flight Analysis 2: Using Google Earth
In this part we'll cover some simple things to get more out of your review. Leonardo is great for flight data and top-down overview, but in Google Earth the terrain and track really come alive.
Once you have your IGC file there are three versions of Google Earth file that you can produce. We'll look at the most detailed version (from Part 1) later. In this section we’ll investigate two simpler options.
1. Using a simple KML file
Open up your IGC file with the GpsDump program mentioned in Part 1 (Go to File>Open>[yourtrack].igc).
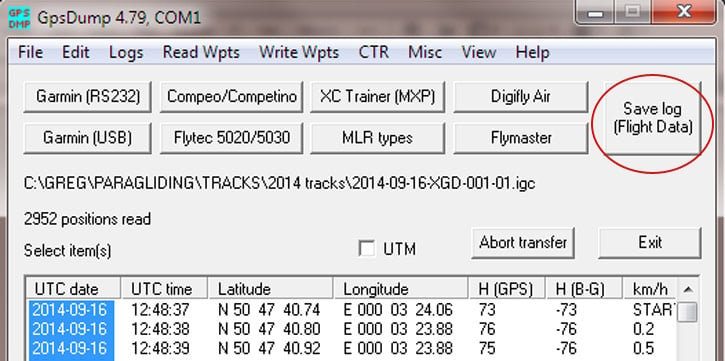
Select all the trackpoints in the bottom window then press the "Save log (flight data)" button on the main GpsDump screen.
Open the resulting KML file in Google Earth. Drag the map around by holding the left mouse button or use the controls to adjust your view point.

Once you have the hang of using the controls to move around, right click on the path to bring up Properties to make it easier to see. Have a play and see what sort of views you like. In the Altitude tab you can extend the path to the ground, and in Style, Color you can reduce the opacity. You can even lose the distance lines (by unchecking the boxes in the side bar) or you can remove the whole side bar if you want (first icon on the toolbar next to the Search tab).

Also by right clicking on your path you can Show Elevation Profile.

But sometimes all that spaghetti is a bit of a mess, especially if you were soaring for a while before you got away. This is where the animation file comes into play.
2. Using the Animation File
In GpsDump, select ‘Save log for animation in GE’ from the File menu on GPS Dump.
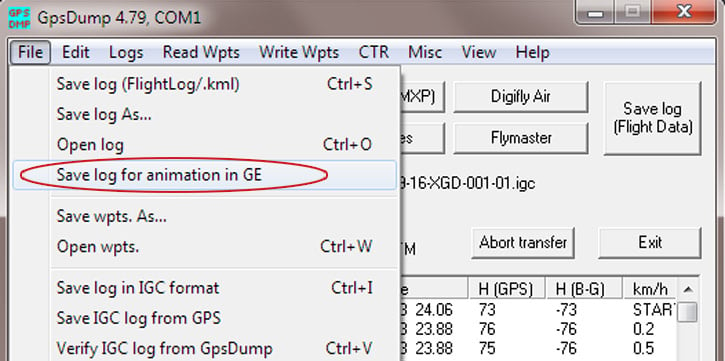
Open this KML file in Google Earth. You can now zoom into the time scale for just a section of the flight.

Dragging apart or closing up the start and finish markers near the top left of the screen determines how much track is shown at one time. The plus and minus icons determine playback speed and can make it easier to shorten your segment.

The other thing you'll notice is your elevation profile now comes with groundspeed info too.
This is the same flight; the red part of the graph shows my height, the blue section shows my speed. The arrow on the trace shows where the path has the values marked at the position on the graph.
3. Lessons from the flight
The memory of your own flight plays a large part in guiding a meaningful analysis. You might not learn much from looking at my flight but it might give you ideas for things to look for.
There are chunks where my groundspeed significantly increases for short periods despite heading upwind: I am on speedbar. I can see whether I accelerated as I should when encountering sink or heading into wind. Although I felt like I was on bar quickly and for ages I can see from the timestamps that I was initially hesitant before pushing, whereas at the second push I was much more on it.
At the first climb I dithered as no-one else went with the plan and I was trying to decide what to do. Once committed, I can see I was much more decisive in my flying.
4. What can you learn from Google Earth?
Don’t get bogged down in mathematical analysis! Because of the number of variables that are not accounted for (multiple wind vectors, altitude, wing loading, temperature, pressure, humidity, airspeed, brake and speedbar position, polar curve, the presence of clouds and other pilots) Google Earth is poor for producing meaningful performance measurements but it is good for answering questions like:
• did the climbs get better or worse?
• did the climbs all die at the same height (an inversion)?
• where did that thermal trigger from, was it the bowls or the spurs?
• how long did it take me to climb out?
• was there a lot of drift higher up or not?
• did the wind change direction?
• how far up wind did I really get?
This helps form a picture in your mind and investigate various points of curiosity as you meditate on your XC flight and consolidate the learning. Flying should be more about the feel and less about the numbers but once in a while an instrument or post-flight analysis can confirm what you suspect.
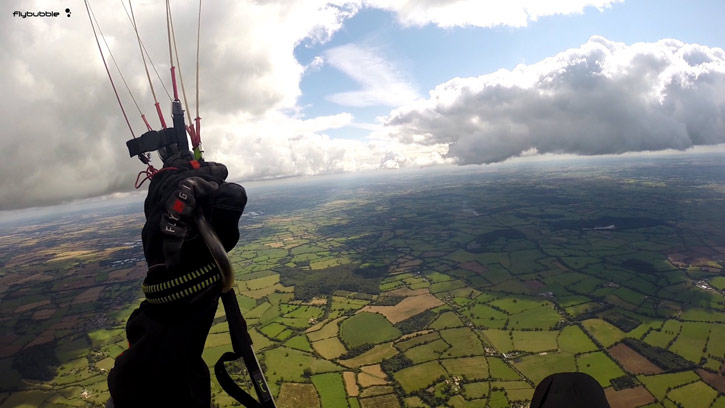
As you begin to look in more detail at your flights you'll find there's more you can discover.
Coming up: We’ll look at multi-coloured traces, more tracklog lessons, and ways to learn from others in comps and XCs.
Flight Analysis 3: Multi-coloured traces
So far we looked at getting the IGC file from your instrument and doing a little more with it in the confines of Google Earth, changing the view and making it easier to see where we've been.
When you have loaded your file to an XC server like http://www.paraglidingforum.com/leonardo you'll be able to pull it back as an extended KML file (see Part 1 - 'Download the Google Earth file').
In getting the hang of the first few steps we've done some important groundwork because now there's a lot more stuff going on in the file and it's good to have a foundation to build on.
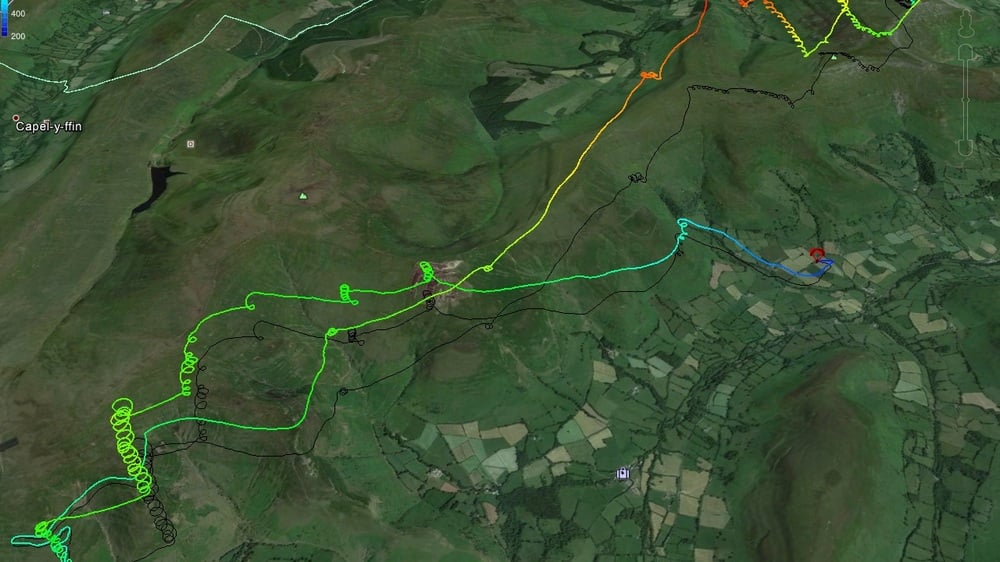
When you first open one of these 'most detailed igc2kmz' files up it looks something like this

but now you know how to clear the clutter and zoom around so we're going to look at the first climb out from the hill and the later low save.
I've shrunk the sliders together on the time bar and removed everything except the altitude marks and the ground 'shadow' line then coloured the trace by climb. Finally I had a pan and zoom around to get this view...

This shows the climb as pretty immediate (a well judged launch) but also broken, scrappy and difficult to hold together. There was a noticeable search going on around 1,000m before I properly connected with 'the one' to cloudbase.
Looking at this from a different angle... (and losing the side bar)

we can see the strongest part of the climb out came from the sunny south face and windy west face of the spur coming together to produce a convergence assisted boost...
and instead of looking straight down on the trace I've angled through the slant of the stronger climb to stack the circles.
You can see the shadow line on the ground shows the drift and in the next part of the series you'll see I was a little slow on the uptake here and got beaten to it by Carlo and Nancy, but looking at the flight this way I've learnt something and improved my game.
Using this same kind of angled, rotated view of 'coloured by climb' track for later sections in the flight

we can quickly and easily see the rest of the climbs were mostly weaker than the first one to base with the exception of the low save at the far end of the ridge.
Learning point, it was a tricky, fickle, day so I shouldn't beat myself up over a 'small' distance.
Low save

I came in at the bottom left corner of the screen having found sinky nothingness all over the ridge and in the back of the gullies, I even went round the corner to be sure it really wasn't soarable and then when I gave up on the ridge and headed out to the flats in front (where the glider mark is positioned) you can see the pronounced left turn out of a stronger (more blue) sinky patch. Fortunately this sink was the inflow for the climb out but what puzzled me afterwards was how the climb fell apart on me...
Learning point: when the ridge isn't working the flats often are.

Now with the altitude marks back on you can see a pronounced drift above 900m so with hindsight and looking at the trace coloured this way it's easy to see I circled upwind and out the front of the low save thermal, this is unusual for me, because I normally fall out the back.
Another learning point: don't get complacent about being 'established' in the climb.

The day did 'blue out' (no clouds) and get more windy (it started very light) so maybe the bowls at ridge height would have worked on the way back but I didn't go for it when I had the chance and bailed to land in the valley rather than risk it in the boonies. Given the walk I then had I'd have been better doing some hike & fly from the top of the ridge 'cos in the valley it was just hike & hike.
Learning point: pay more attention to drift and groundspeed.
Colouring by altitude and speed can also have their uses in reviewing a day, colouring by time can help make sense of a long ridge flight and also make sense of some of that spaghetti.
This example is coloured by altitude, and you can see that the climbs didn't go as high, later on.

Coloured by speed, you can see more easily the points where you accelerated

Coloured by time with a different flight (my Winter at Cloudbase video)
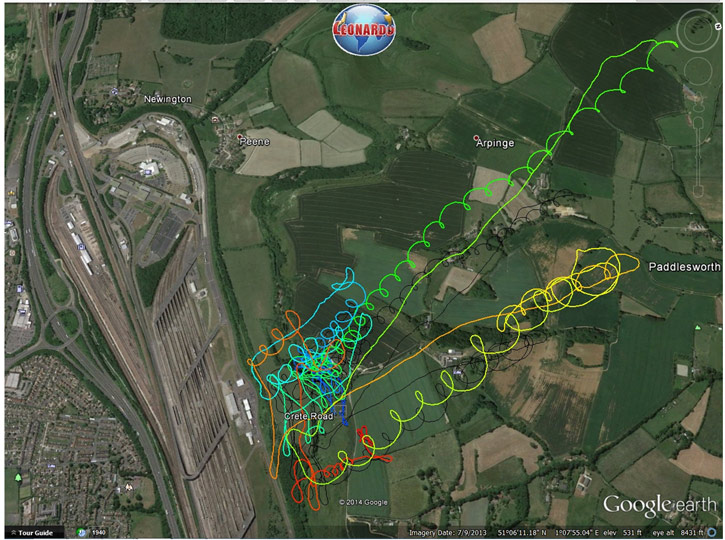
It starts blue, ends red having gone through green and yellow. Looking at it this way makes the sequence of the track clearer whilst looking at the whole thing (instead of sectioning it out with the animation)
Here's another colour by time
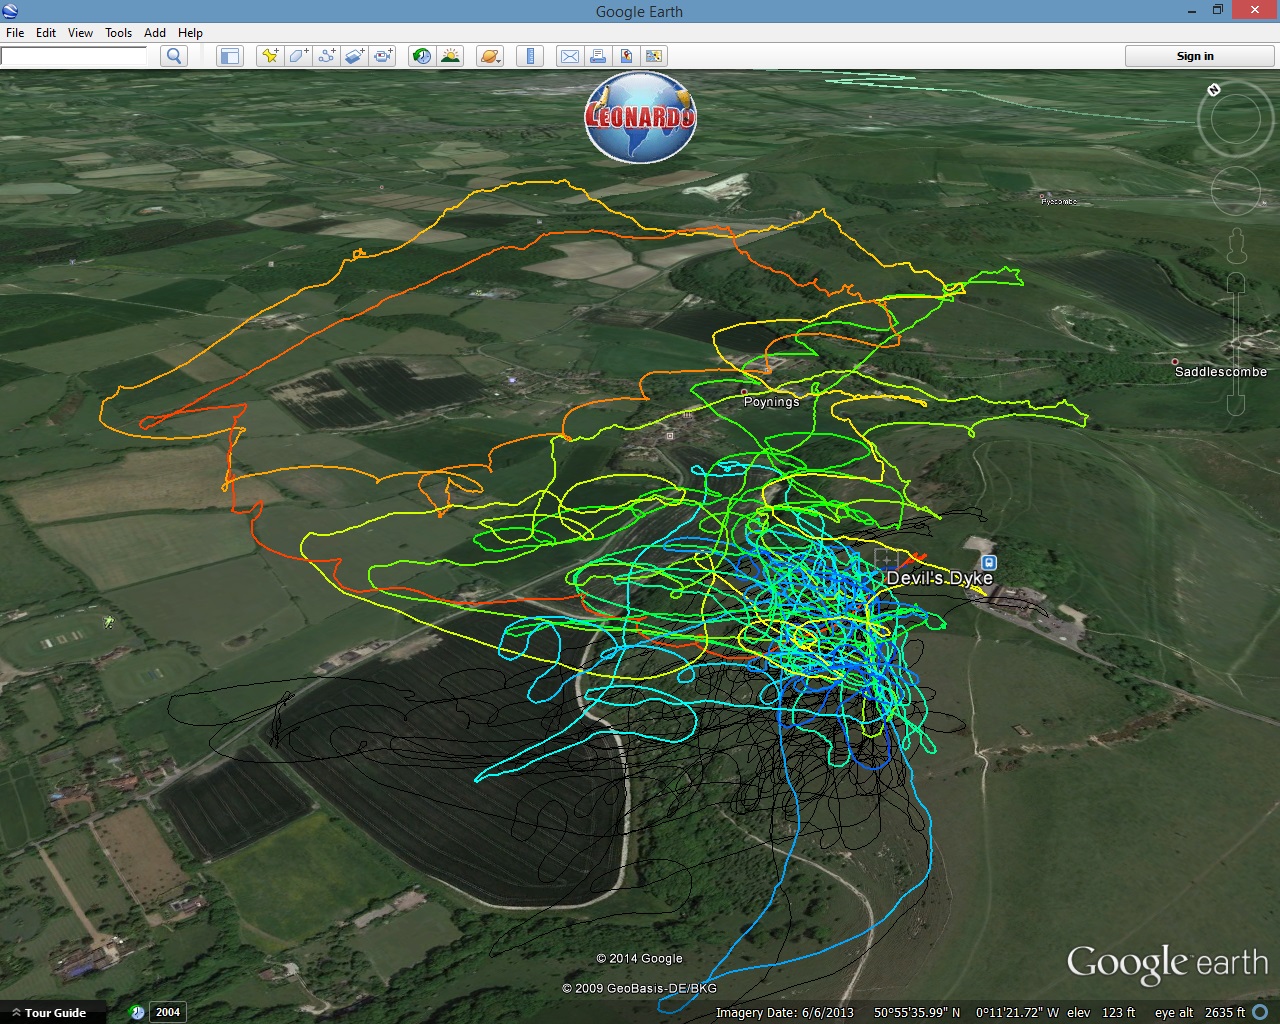
Which makes a little more sense than the 'before' shot
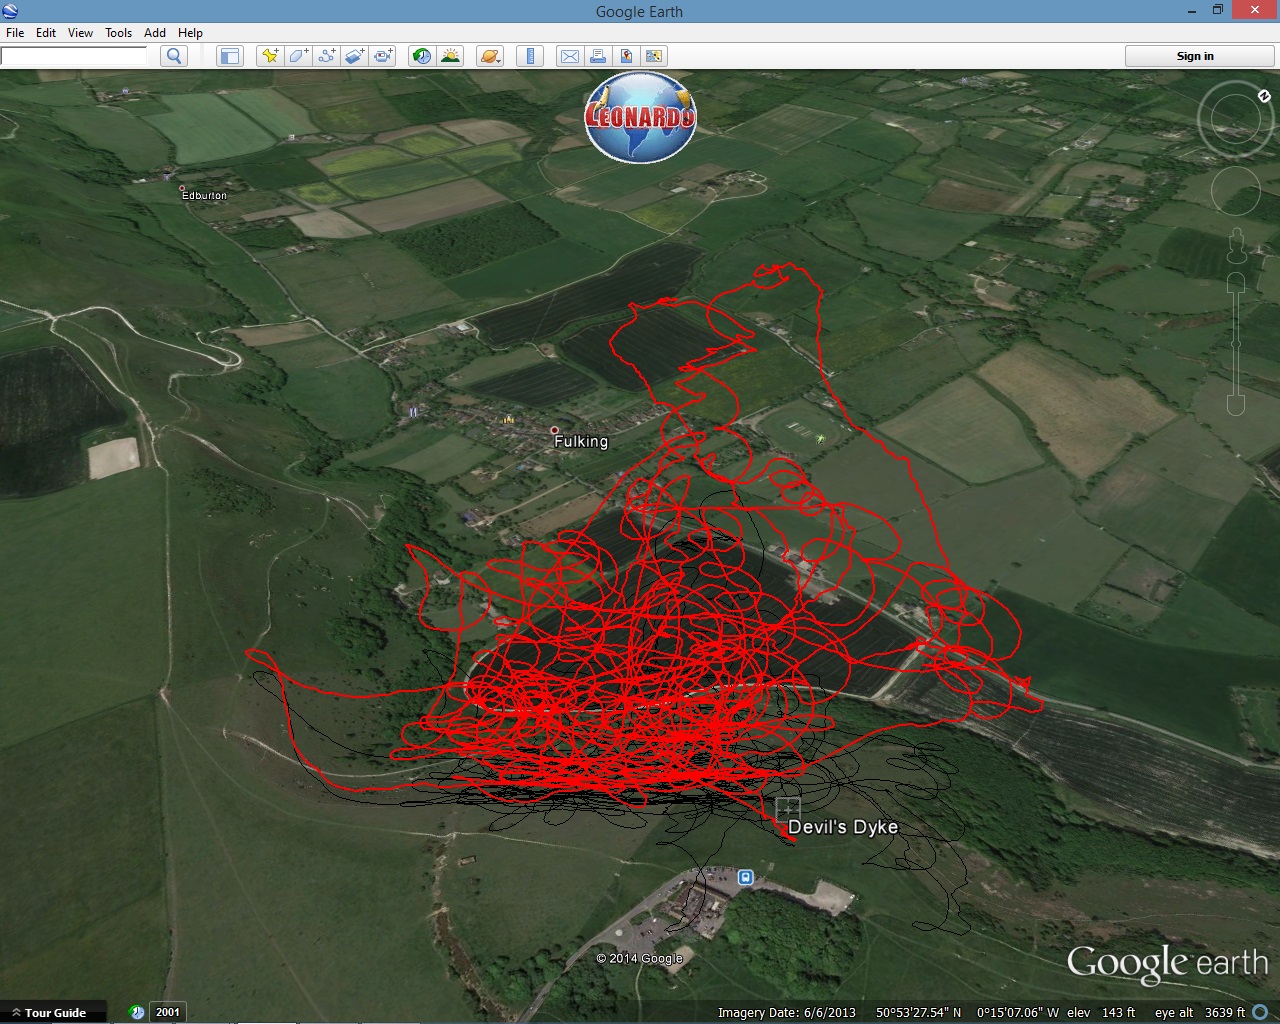
When you start to explore your own flying in this way you'll discover your own learning points, these are just some tools to help you do the job.
Flight Analysis 4: Flying With Others
You can look at the traces of other pilots in the same way that you look at your own. Doing this can highlight different things:
- where they got low saves on their XC's
- how fast they climbed out
- how / where they cored the climbs
- when they left the climbs
- how they handled detours for airspace
- whether they flew faster or slower on the glides
- how much searching did they have to do before climbing out
- how did they search
I like to look at others that I flew with. The Google Earth animation files are best for that.
Get some tracks
If you are lucky, you and your friends posted their flights to Leonardo, in which case you can click on Find And Compare Flights feature to quickly compare similar tracks in Google Earth (don't forget to maximise the screen). If you want the nice 'coloured by climbs' etc options, download the 'most detailed KMZ' files and open them in Google Earth directly.
If your friends use something like UK PG XC League, there's a bit of a faff to get nice animated tracks. Once you're familiar with the procedure it's much faster.
15 minute faff (IGC > Animated KML)
First, download the IGC file of the other pilots from the server.
How? On the UKXC League, once you have a flight detail page open, clicking on the 'Tracklog' plus box reveals the secret IGC download link. Beware, the excitement as you 'steal their tracklog' can leave some pilots breathless.
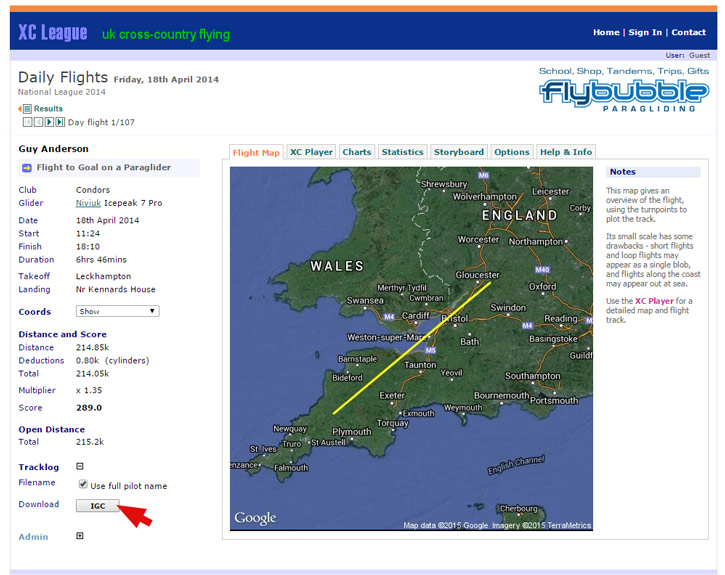
Once you've gathered some comparative tracks, you need to convert every IGC file to an animated Google Earth file using GPSdump, as we've done before in Part 2. Here's a reminder:
Right click on the downloaded IGC file and choose 'Open With' then find where you have stored the GPSdump program on your PC (probably in Downloads) and check the checkbox 'always use the selected program to open this kind of file'. This will make the workflow faster and simpler in future.
Select all the trackpoints (click on first one, CTRL+A) then File>Save Log For Animation In Google Earth). Repeat for the other tracklogs (you can simply double-click on the IGC files now, they should open straight away in GPSdump).
Now open those saved KML files, one at a time. Within Google Earth, right click on each track, select Properties and edit the name so you know who it is (instead of Pilot), change the line colour, width, shadow etc. Repeat with as many pilots as you have patience for.
Tadaa! Squiggly fun in Google Earth.
(If you're frustrated by this faff, you can use SeeYou software to compare IGC files without needing conversion - or get your friends to start using Leonardo!)
Flight example
Back to the flight. Here are Carlo and Nancy's traces from our Wales trip.

I coloured the traces according to glider colour so Carlo is on the light blue, I'm on the darker blue and Nancy is on the green... Use the time slider to shorten the segment and help ease some of the spaghetti.

At this point you can see I went off first followed by Nancy and then Carlo, whilst I dithered Nancy caught me up and then Carlo led us south east to the stronger climb. I just about managed to catch up by the time we got to base and we all arrived together (more or less).

Looking South towards Crickhowell, I finally give up on mincing and try to catch up, there are others ahead of Carlo too, everyone is climbing strongly and there is a big cumulus forming to the south of us. I still can't figure out why it took me so long to spot what was going on nearby. Carlo clearly had it sussed and Nancy was well ahead of me...
Learning point: while climbing, pay more attention to what is going on up ahead.

Here we are all caught up and together at base...
The thing that surprised me looking back at this was how tight and aggressively I'd gone for the climb compared to Carlos's big lazy circles. Also both Nancy and Carlo had started widening the climb much earlier and avoided the wispies altogether, where as I went plowing through on the fine line of what is just about acceptable for flying IMC in company.
Learning point: plan ahead, where will this climb take me?

So, about this plan that we had, then...?
Learning point: take a charged radio if you want to fly together.
I wonder if Nancy briefly thought about following me (and The Plan) or Carlo. Perhaps there was a chunk of cloud in the way?
In all seriousness, most of what I used these files for (in this particular format) was done with the animation running slowly and then looking at where we were from various angles from above and below. Seeing who went where, and when, and who made the move to the strong climb, did I climb better for climbing tighter, did we loiter at base much? Answers to those sorts of questions.
Exercise: load your own flight to an XC server (even if it's just a top to bottom) then download your track and at least one other pilot whom you flew with at the same time. Load them both in Google Earth and drag the animation slider slowly along so you can compare.
Flight Analysis 5: Studying Top Pilots
When you get many pilots on the hill together you can analyse the big XC days or competitions. For this you'll need to find out what the most popular XC server is for the region.
In the Alps, it's XContest; worldwide it's Leonardo; in the UK, the UKPGXC League (paragliders) and UKNXC League (hang gliders).
Focusing on the UKXC League, you can identify big days by the high score and number of flights entered on Daily Flights. April 18th 2014 looks promising, with almost 100 XCs. Viewing the table for the day reveals a list of lofty achievements, mostly from a site called Leckhampton (hover your mouse over the flight score, it should show a description of the flight). So I've opened the top ten flights that originate from Leckhampton in ten different tabs (for quick stats comparison).
Exercise: Here are the converted tracks from the day. Download that file and at least one more track from the day from the UKXC League (for practice), convert it to animated KML then open all of them in Google Earth. Once you have done that we can begin to learn from Big Wednesday.
Here's what we can see:

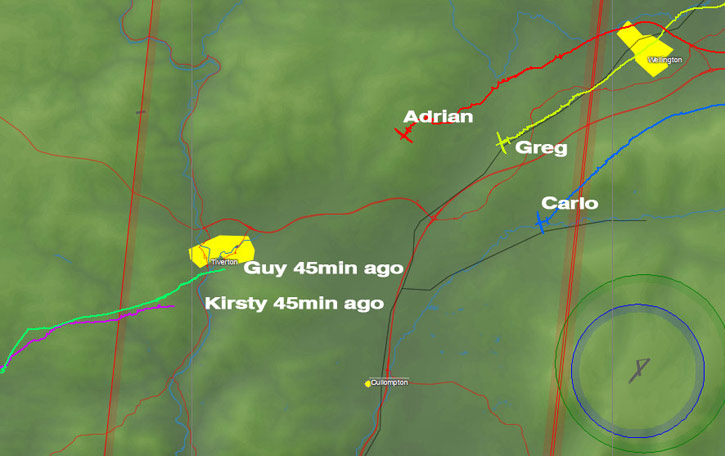
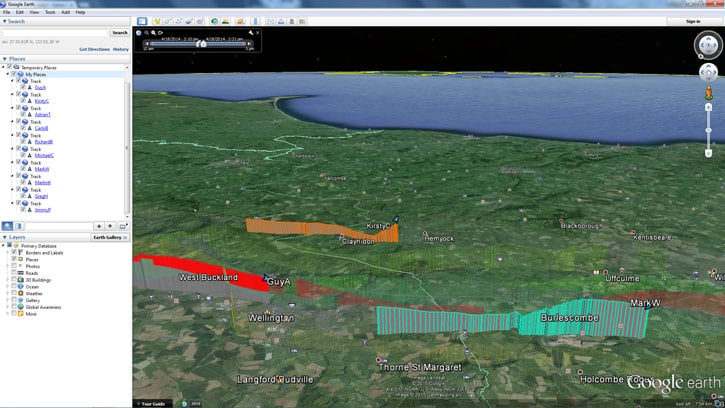
Mark, Kirsty and Guy are the first away around 10:23.

Twenty minutes later Jimmy commits whilst the others wait for it to get better, the group of 5 climbs out at 11:12 almost an hour later.

Although Michael is the last to leave he's probably not on his own as at least another 10 went (and subsequently posted flights) plus a bunch from nearby Ubley.

I've kept it to the top 10 from one site, for the day, since it took about five minutes to pull the flights from the UK XC League website and then about another 10 to load them into Google Earth and play with the colours. Reds went furthest, blues the least but all were well over 100km on one of the best spring days the UK has seen.
So what can we learn from this..?
We can scroll around to see most pilots left from the Eastern end of the bowl and that there was a fair bit of scratching to get away, there's a notable difference in the line between the first 3 and the line from later pilots. Using the Ruler tool we can see Jimmy with a 10k jump on the bigger gaggle, we can see who's sticking together and leading out.

Most of the learning is done by playing through the file and looking at who went where and when. Who made the moves, how high did they take the climbs and such.
Extending the track to ground helps too

Here you can see that when Kirsty separated from Guy and Mark she was much lower so when the others pushed West at the top of the climb she was still climbing... Using the view in this way makes the reason behind the split more clear. Extending to ground also helps you see how high the pilots were but it can make the image more messy, so reduce the shadow extension opacity to 50% or less.
Sometimes you might review a bunch of flights and only learn one thing, sometimes it reinforces things you already knew, sometimes it helps you find out how others got through a difficult patch of terrain.
You can approach competition tasks in much the same way but often it makes more relevance if you were there on the day too. Competitions like the PWC will often have an animated Google Earth file available for the entire task with all the pilots included, thanks to live tracking.
The big points I got from the Apr 18th day (I wasn't there)
- Leaving the hill early often pays, but not always. Being late to leave means you have markers ahead to aim for. Ultimately don't stress about not getting away, just be sure that what you are going in is good. (A lesson reinforced)
- The eastern end of the bowl worked best on this day (news to me, I might check other tracks)
- Working together works well but know when to quit the gaggle, be happy to do your own thing
- Landmarks and ground features to use as markers and boundaries for the routes around and through the airspace, how early before the airspace do pilots push and adjust track?
What you learn from tracklogs is up to you. Hopefully this article has given you some ideas of what to look for and how to get more information.
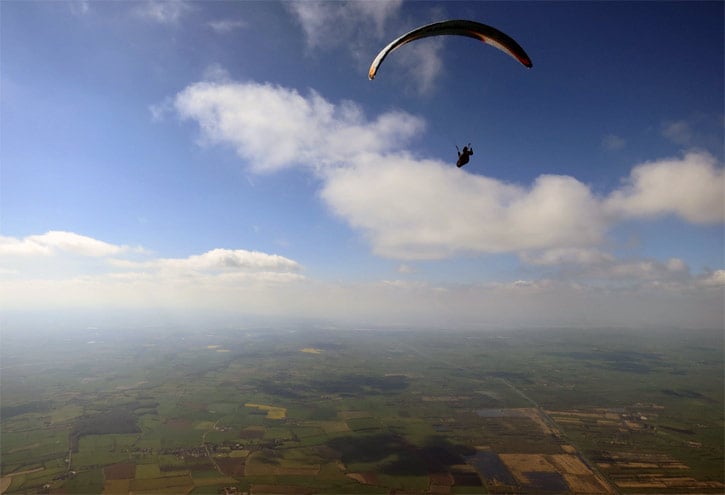
^ Going XC on 18 April 2014 from Leckhampton under a friendly sky: Greg Hamerton glides on
Flight Analysis 6: Competition Lessons
Finally we're going to look at what I learned from my tracks at the Nordic Open in 2012. This was my first competition since 1996 and Task 1 was my first proper XC flight since 1998, it's fair to say I had a steep learning curve!
When I was last competing you used a camera to record your journey so there was never anything to learn from the good pilots, all you had were some snapshots. Now with GPS you can see every second of the flights from every competitor. If you're lucky the competition is using livetrack24.com and you can get one KMZ download of the entire field for easy analysis (just switch off those pilots you don't want to watch, in Google Earth).
Lesson 1 - It's a race!
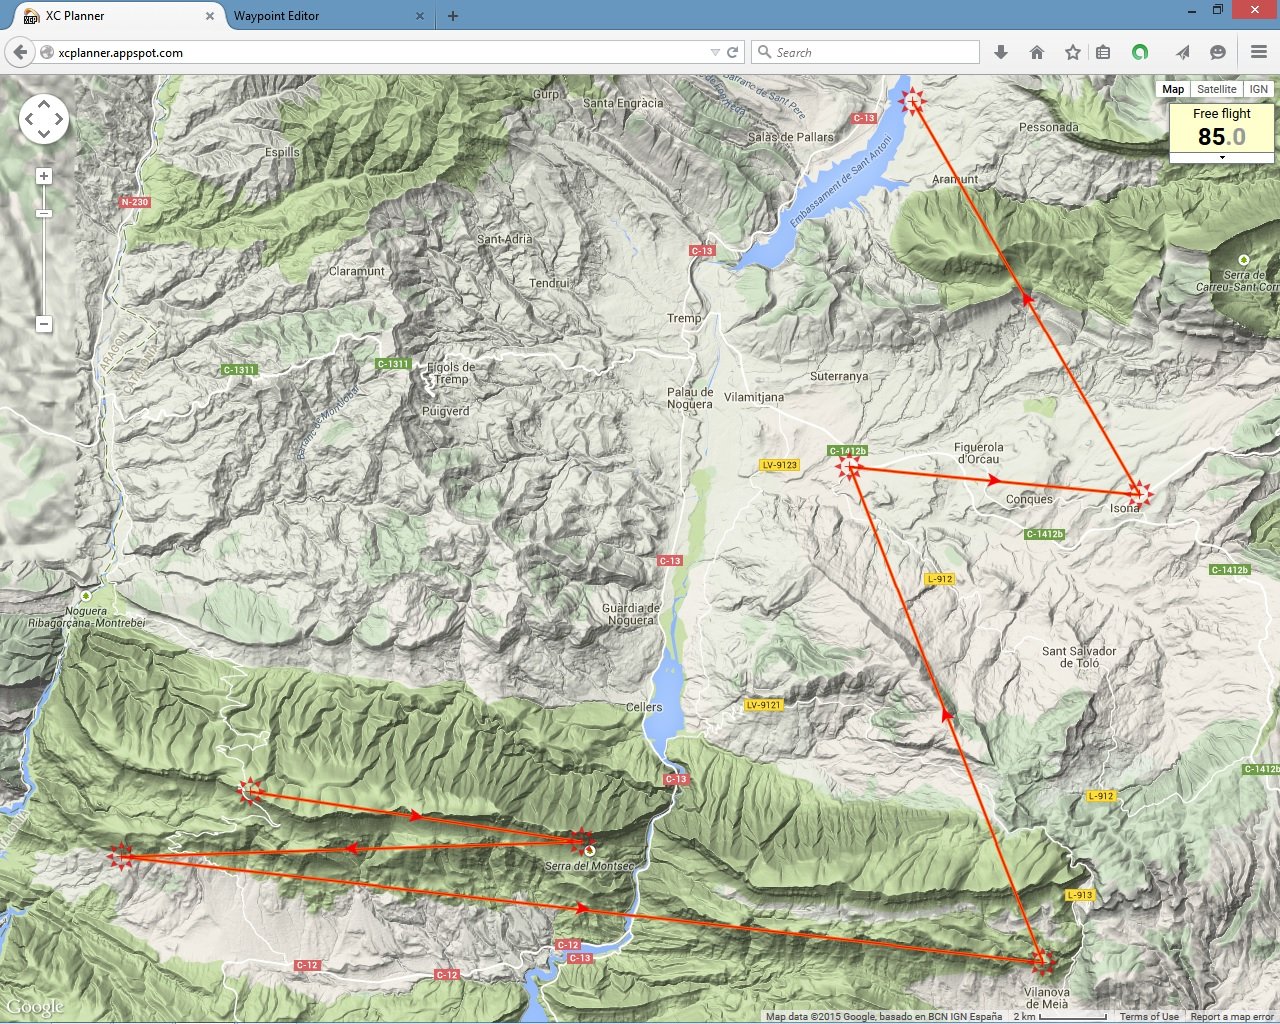
I needed to start quicker, I actually made goal but later at scoring found out I was number 75 to do so... looking back at the tracks of those who finished way ahead it's clear I spent too much time in the main valley.
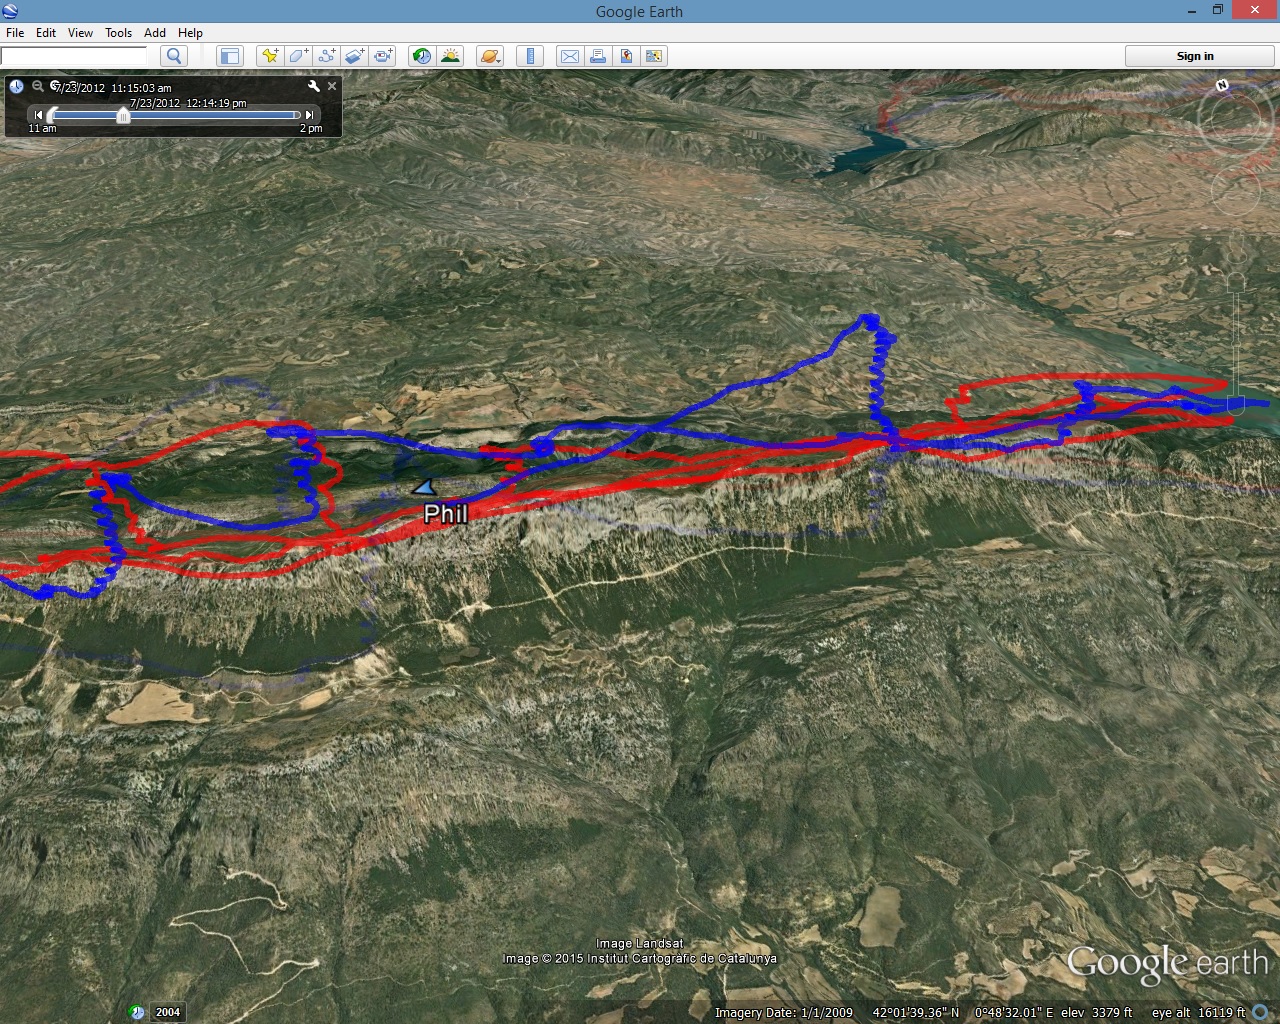
My track is blue, the winners in red. I spent time climbing much higher than everyone only to end up back at ridge height, when the others took a faster straight line.
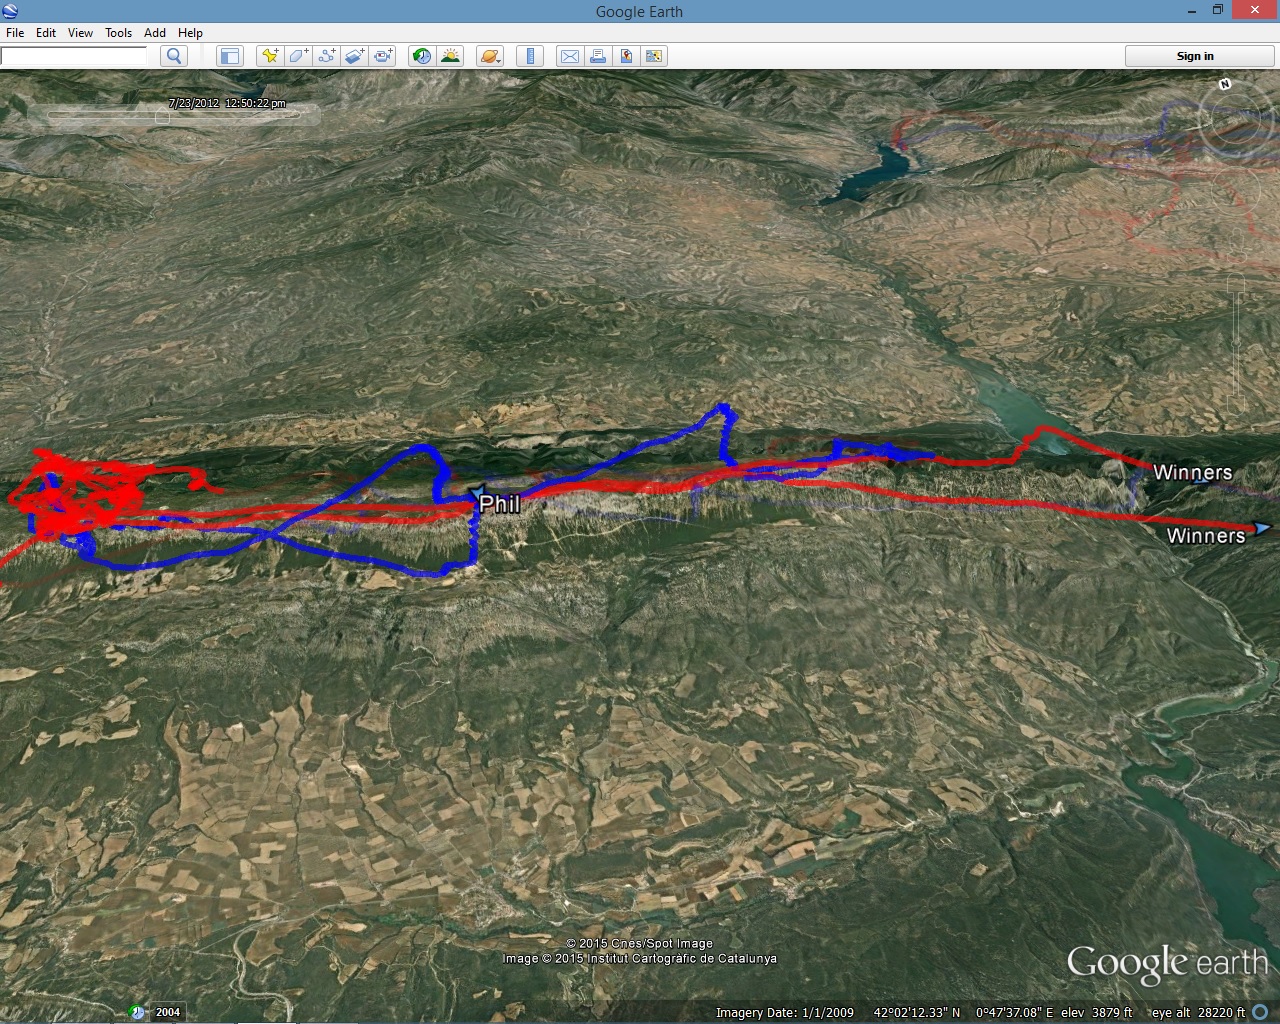
20 minutes after the start, the winners are pulling ahead with confident gliding tight on the ridge, using the fact that the slopes create a wash of rising air that benefits long glides. Because I've taken the more conservative approach of moving forward of the ridge, I encountered more sink before connecting with the more spaced out thermals.
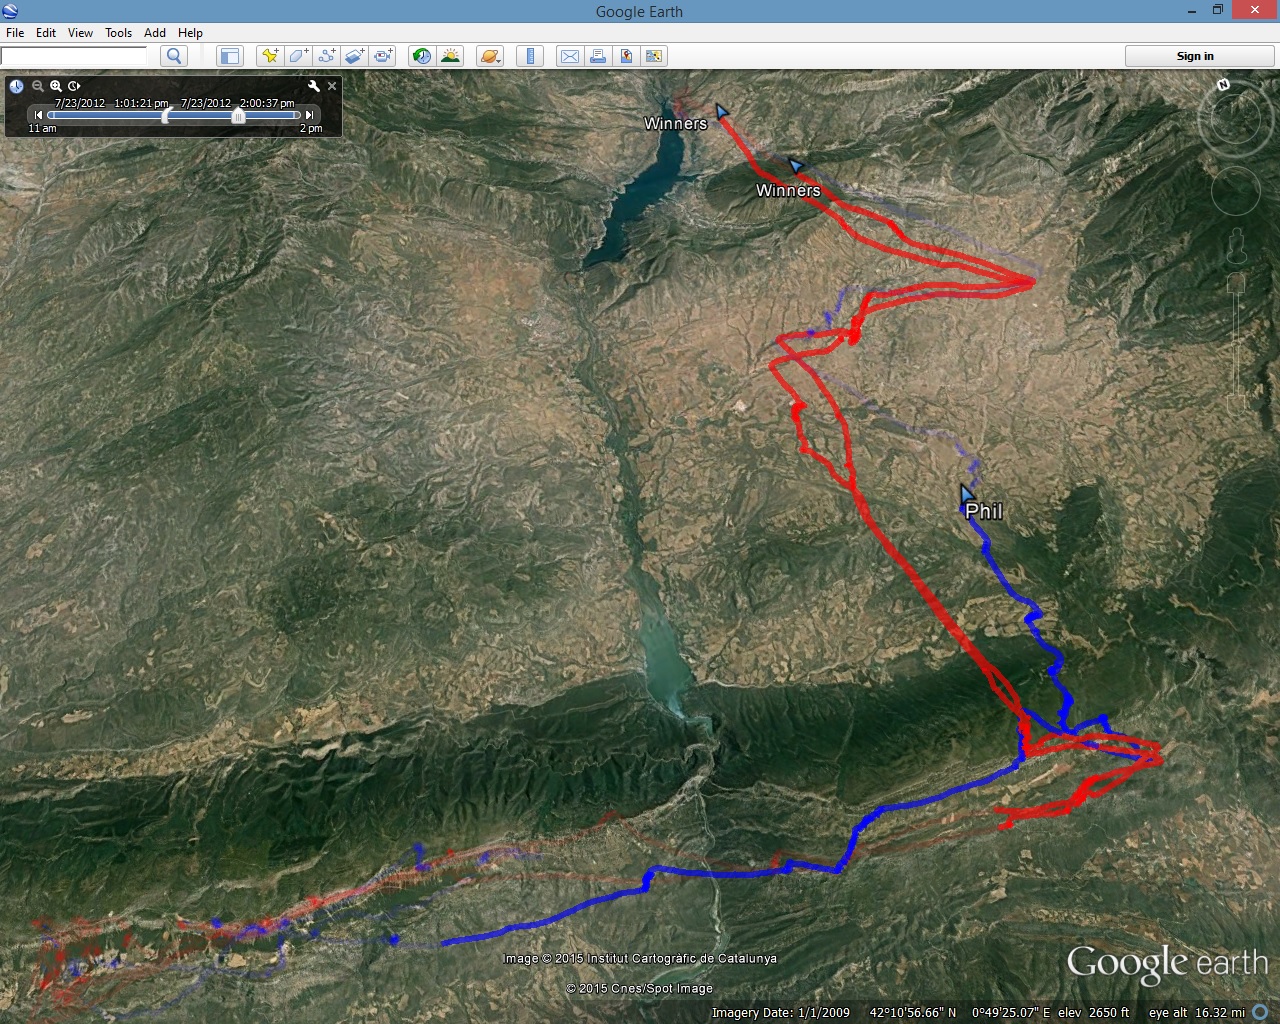
Once over the canyon and into 'flying this route' mode I can see I did much better but could still have been braver on the final glide...
Lesson 2 - Not thinking straight
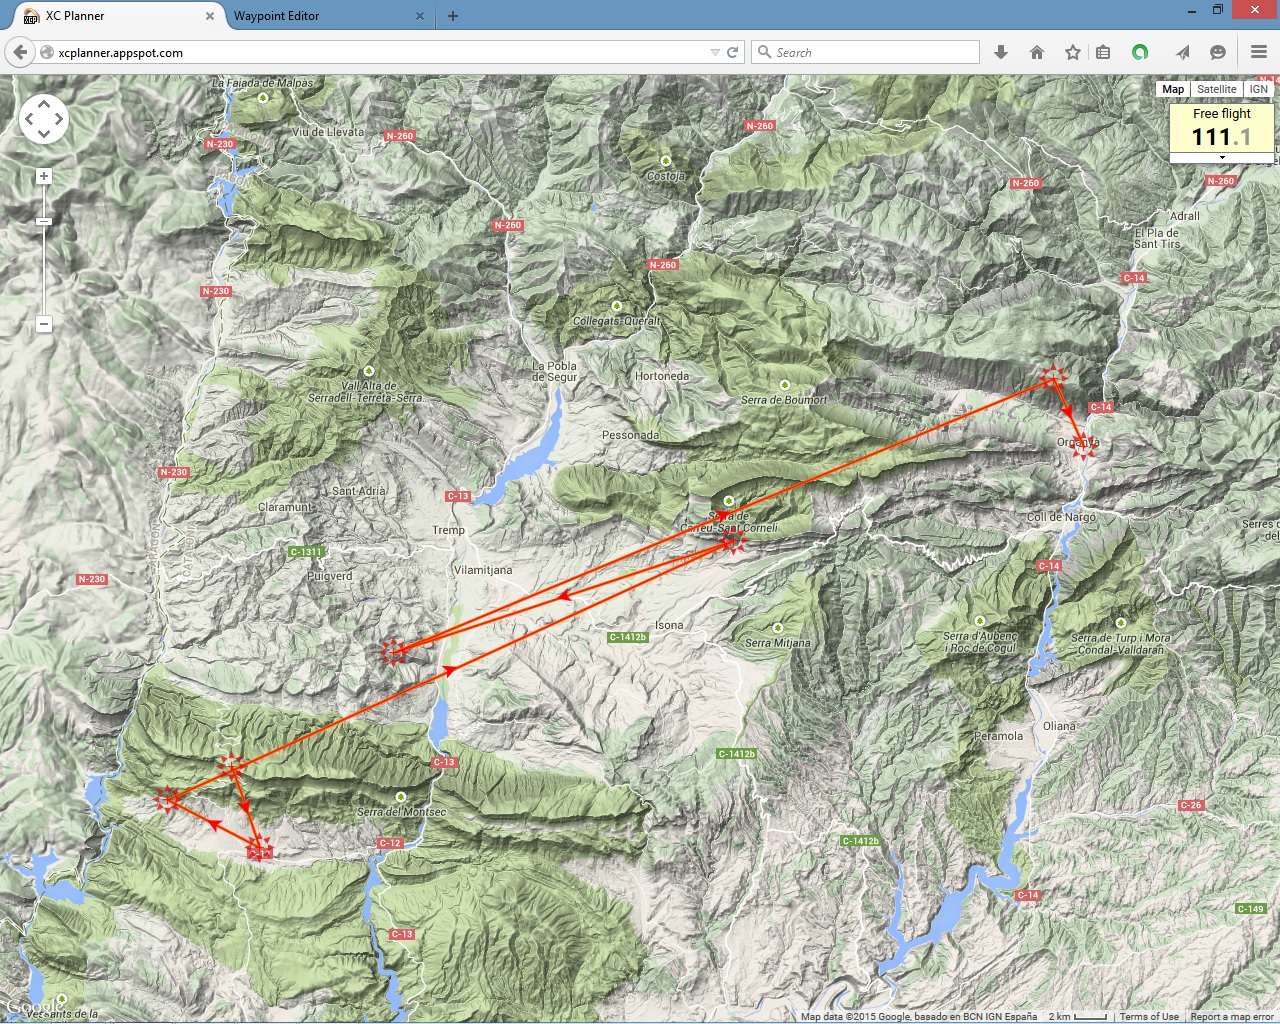
I nailed the start but needed a wee... distracted by the sensation I ultimately made some poor choices, but also some good saves along the way. What really undid me on this task was not climbing high enough before setting off on the into-wind leg over the flatlands. Those who went higher had a much easier time. Learning when to push on low and when to hang back and get high was key to the week.
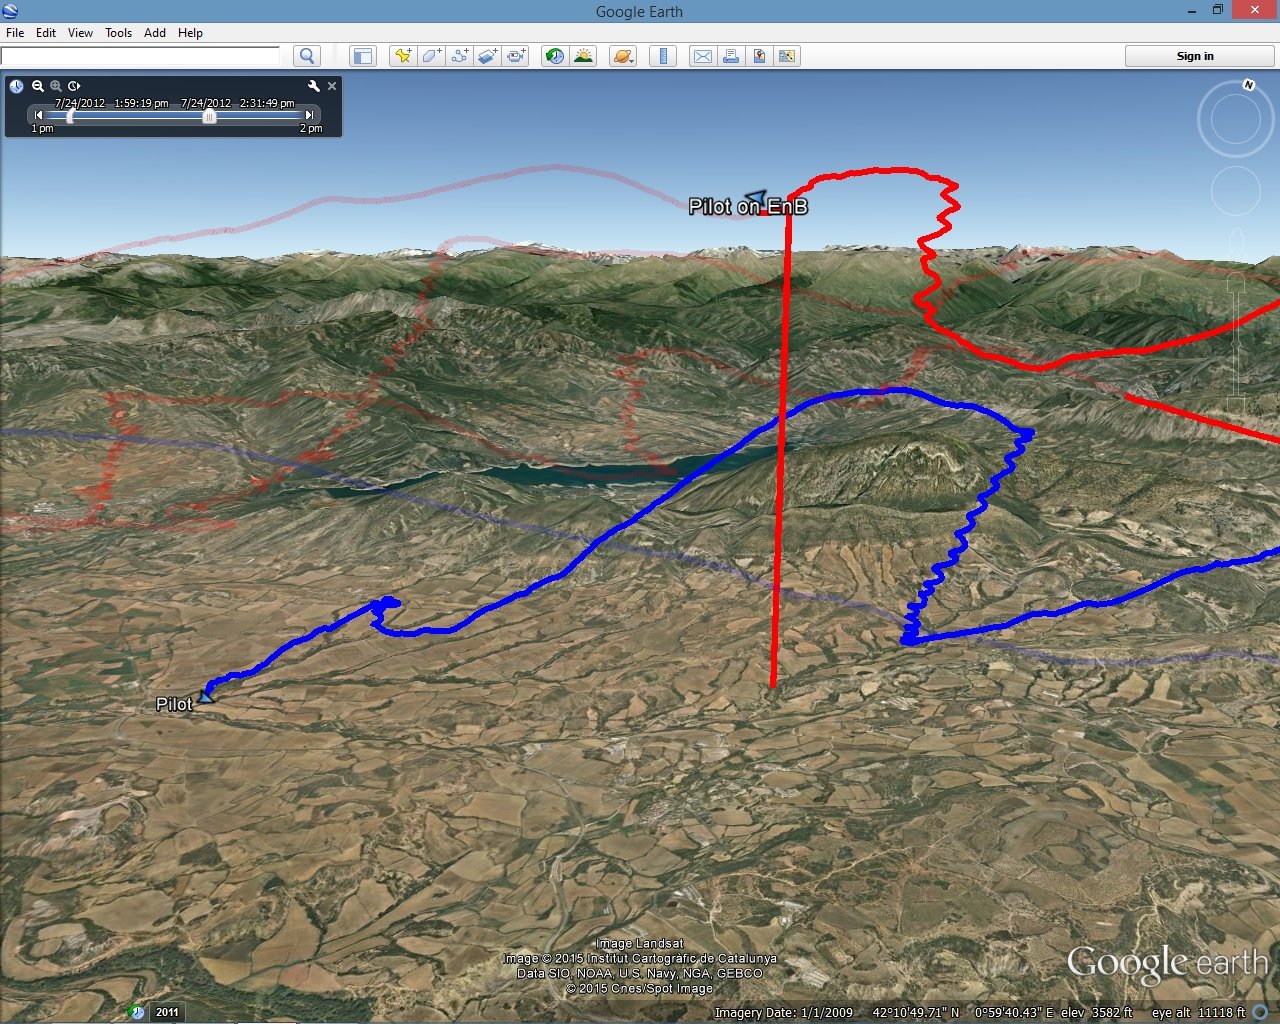
So there's me pushing on and not taking the climb all the way, having eked out six decent low saves I was sure I could muster another but if you roll the dice often enough you'll come up with numbers that don't work for you...
The wind was lighter at altitude too and this was part of the morning met brief (that I also seem to have ignored). You can see this in the angle of the stack of 360's - at higher altitudes they are more vertical. So staying high gave pilots a faster glide against the wind.
Lesson 3 - Zero is zero
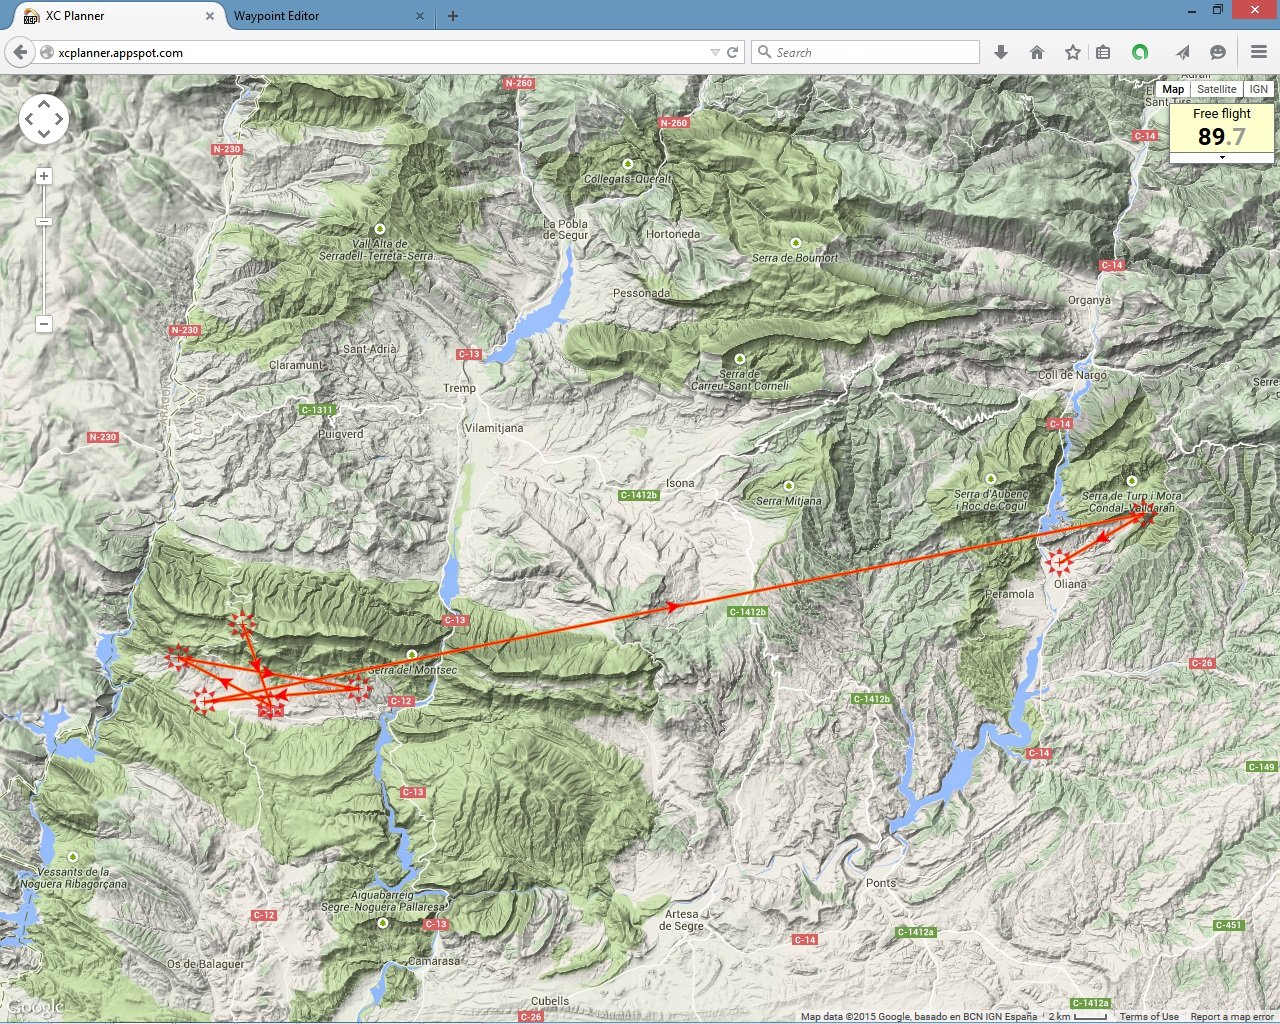
The east wind picked up so it was crucial to get east early. By the time I crossed the canyon I was about an hour behind the leaders (those who made goal). I couldn't figure out how this had happened at the time. By looking back it was easy to see I'd spent a lot of time circling in nothing. Every 360 can be half a minute and after twenty or thirty of those then you're then 10-15 mins behind. If you're expecting 2m/s climbs, and you are not getting them, then you have to push on.
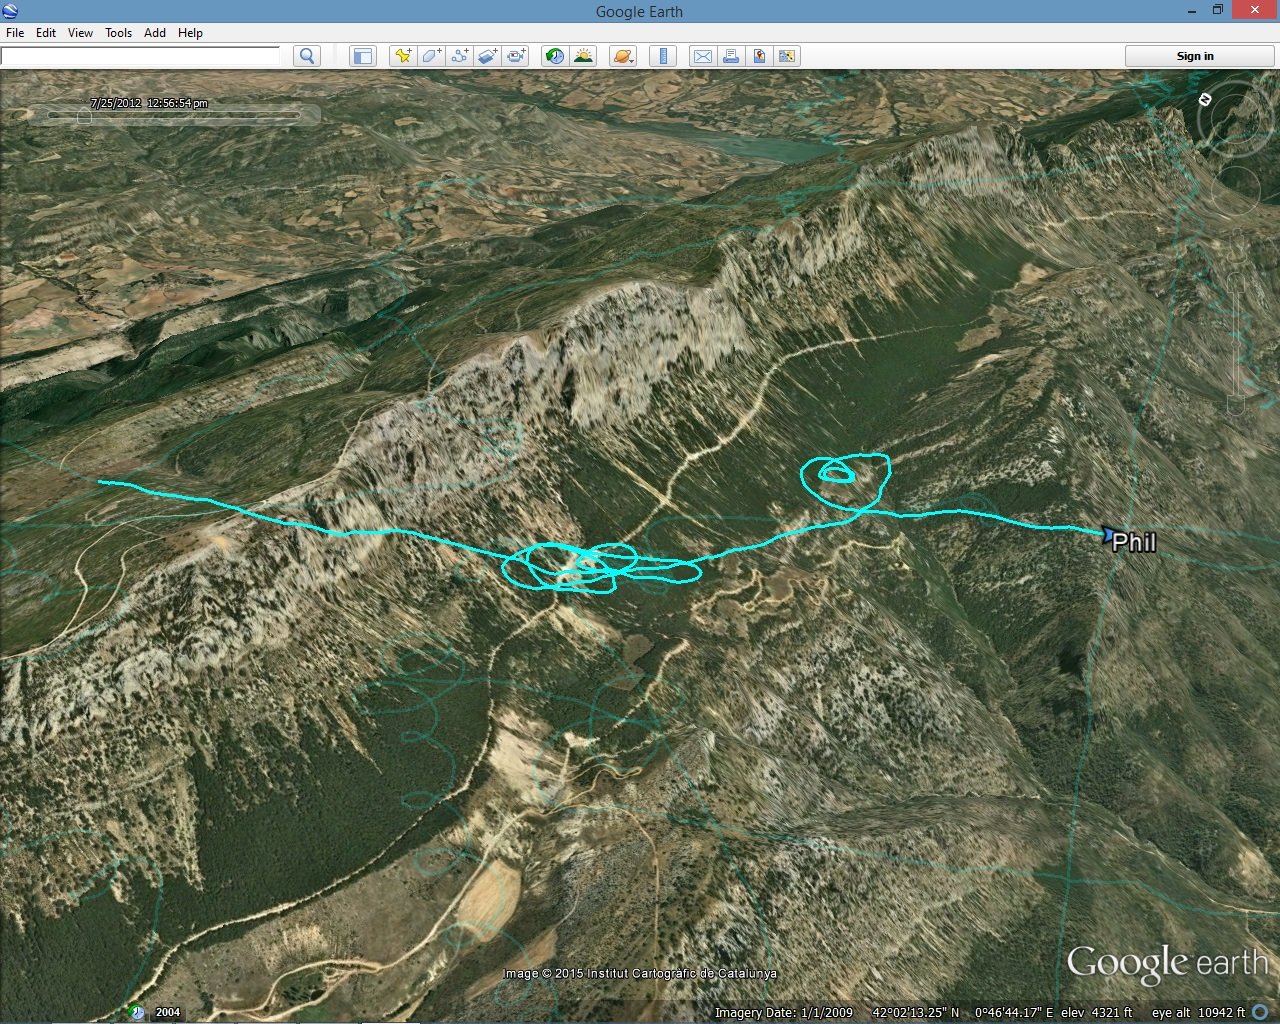
In the UK a half hour of zeros might make a big difference to your day, but when there are better climbs expected and there's no obvious reason for your weak climbs (like big shade or wet terrain) move on! I wasted five minutes here and did this at least three more times in the task before crossing the canyon, as a result I couldn't get East fast enough before the forecast increased wind arrived.
Lesson 4 - Know when to quit
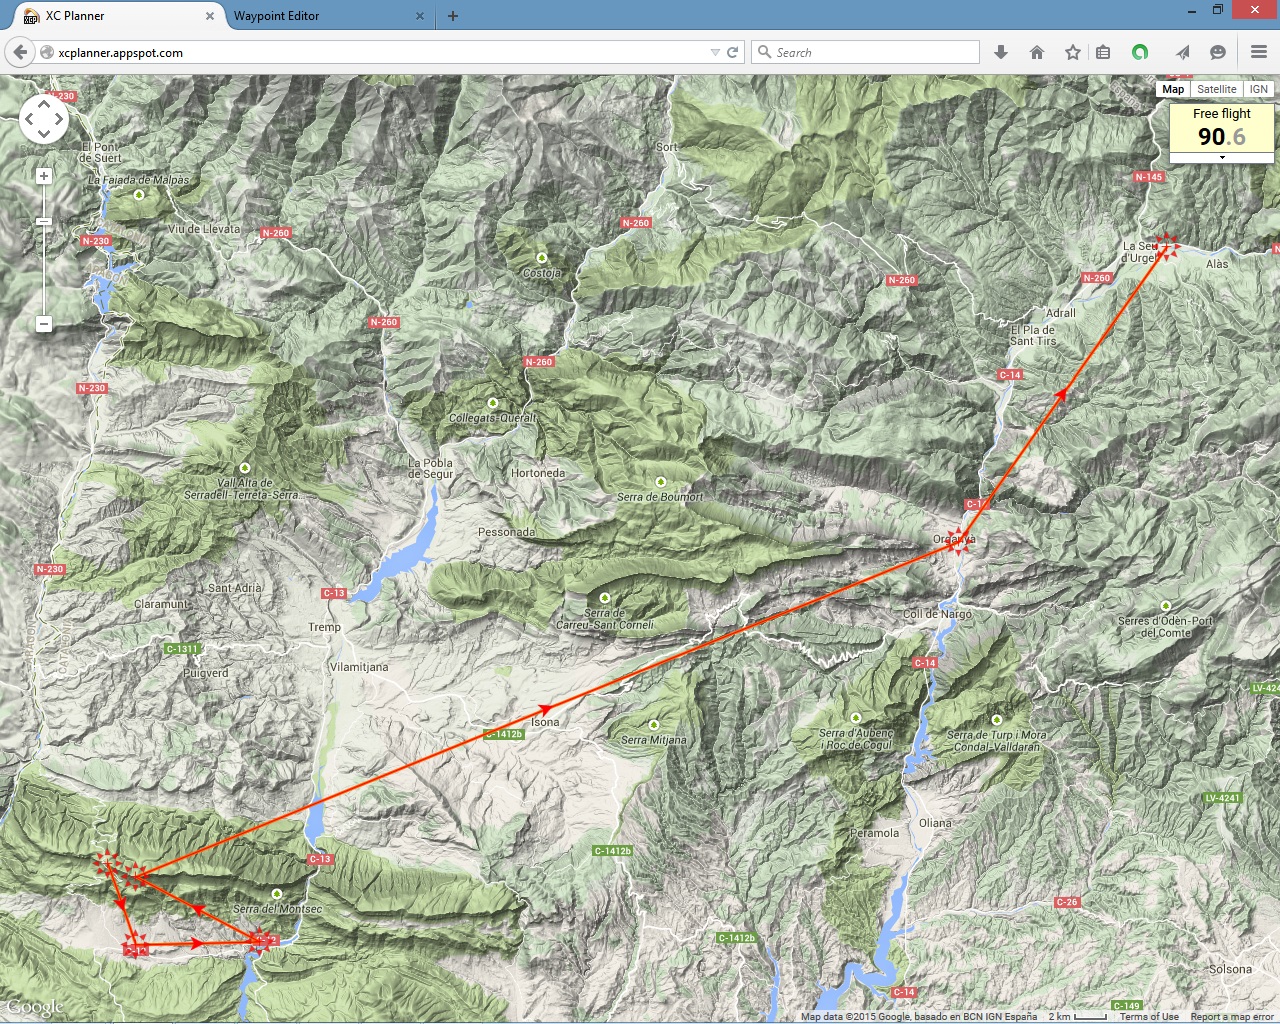
I actually had a really good task and was in a good position up until the storms and overdevelopment put an end to the fun. It was reassuring to see from the track that I got a good start and spent much less time searching. The goal was off towards Organya and I was pleased to see I bailed on the task with plenty of height in reserve, this allowed me to push out to the flats before the weather really let loose.
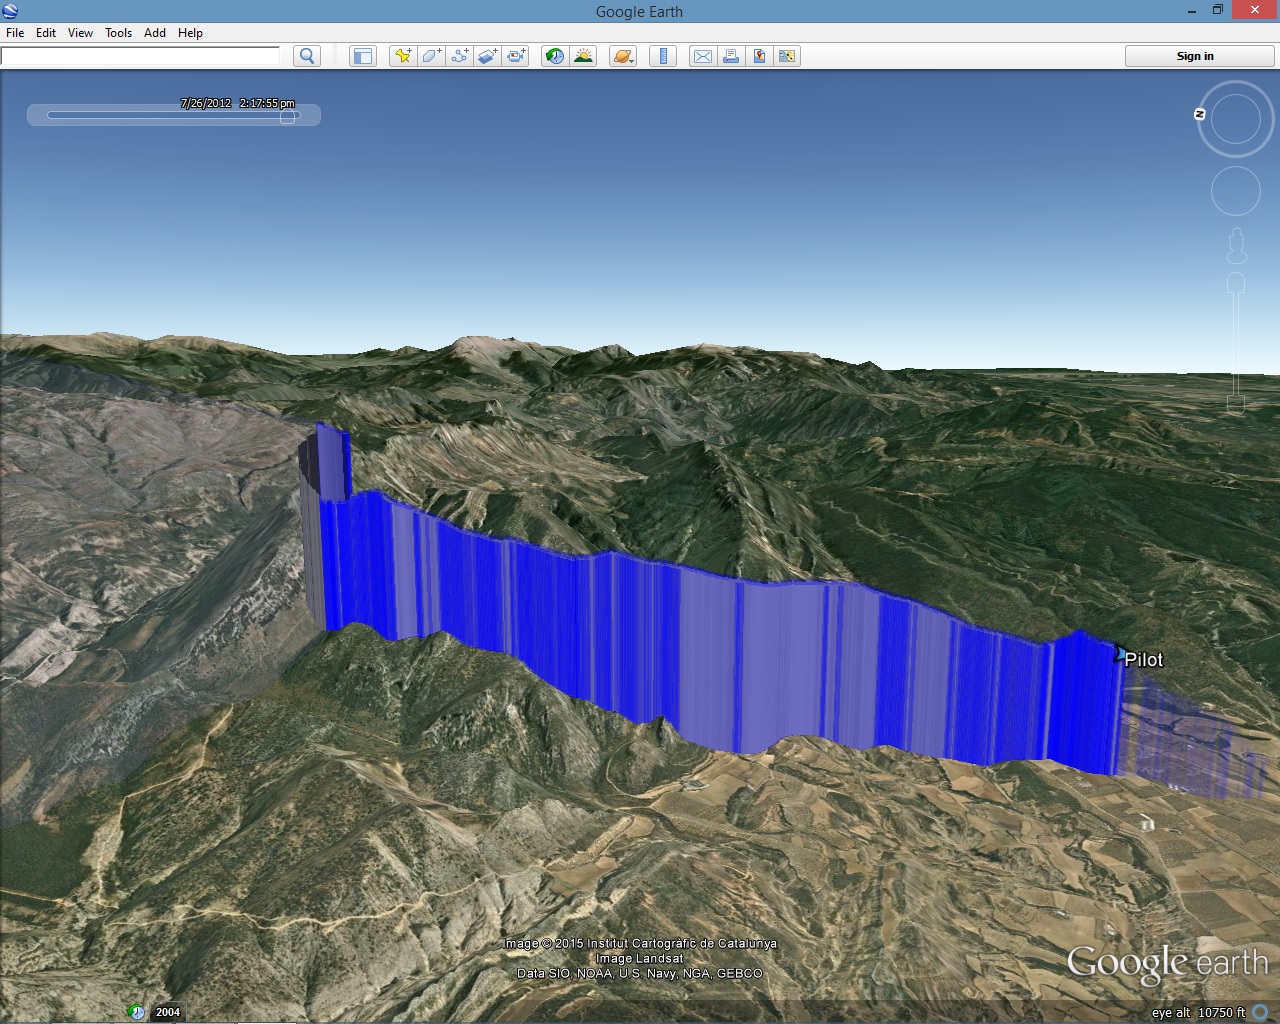
Lesson 5 - Overconfidence is costly
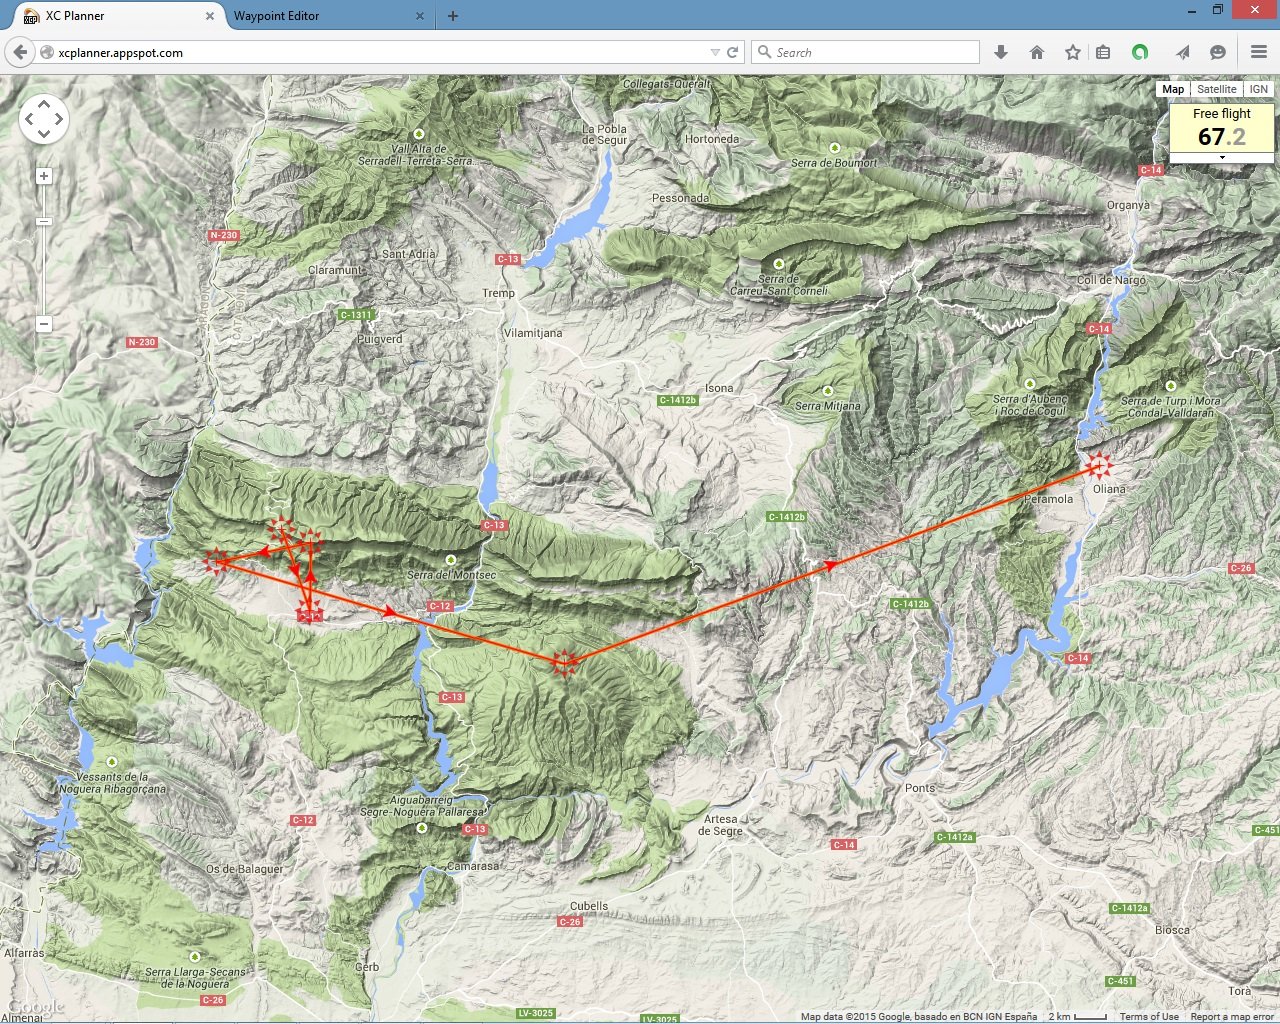
Because of where the turnpoint to the east of the canyon was, I thought it might be easier and quicker to tag it by heading south before the crossing, instead of after it. It was a big mistake and I was very short on the day score sheet. I got carried away by my own sense of self-worth after the good flying on day 4 and failed to respect the conditions...
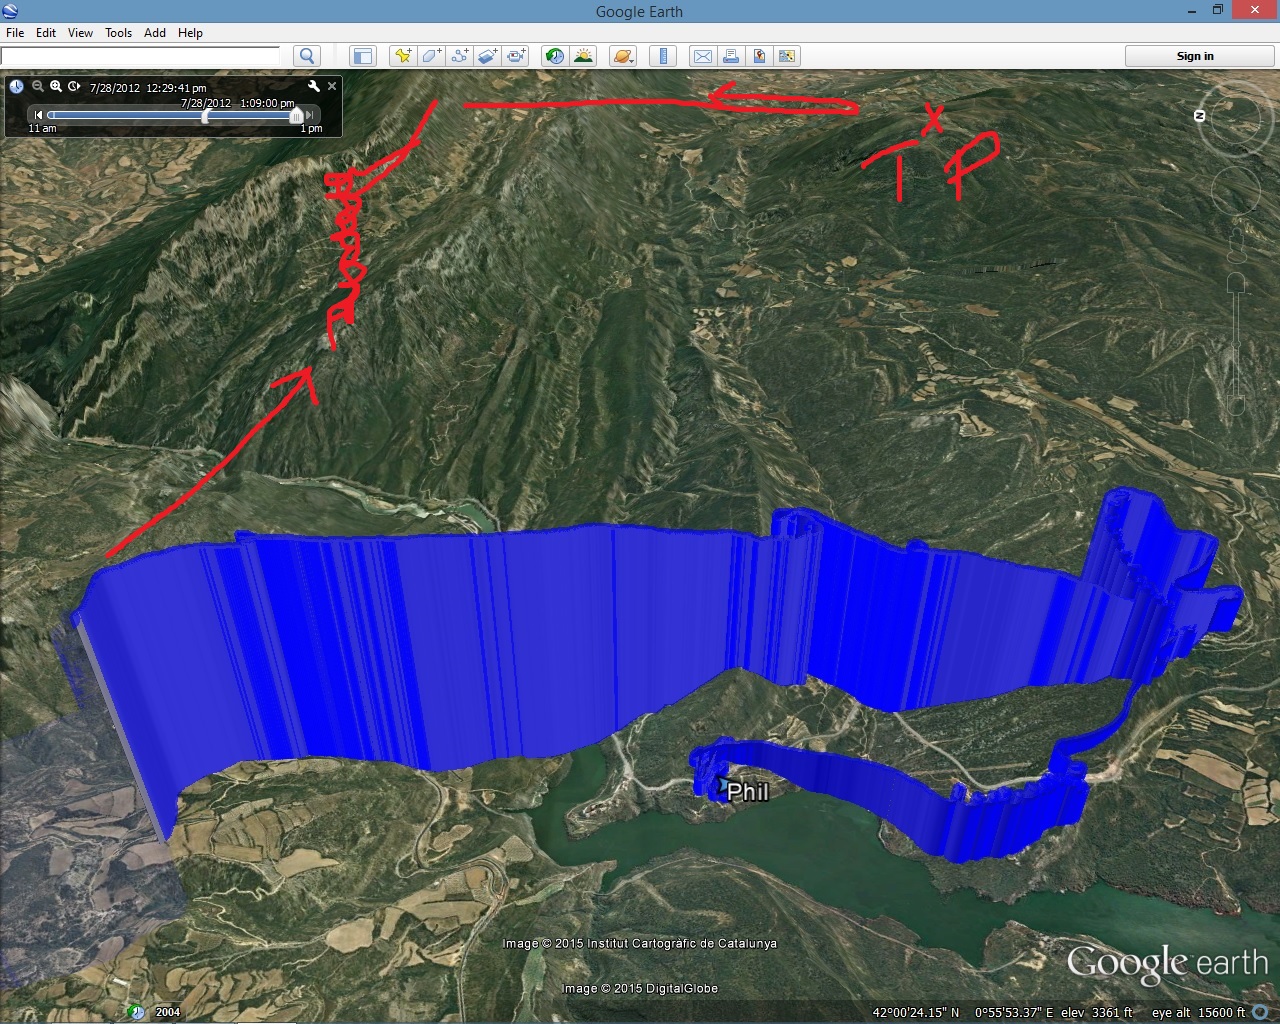
^ Dumbass gets drilled.
The turbulence was so bad that I thought I'd be tossing the reserve at one point. I got silly and carried away and in a comp with no discards you're not gonna achieve anything like that. Also, based on the wind direction, I can see I glided downwind of a large reservoir of cool air (the lake) and so found mostly sinking air on my line to the front hills. It would have been better to have avoided the area altogether.
Lesson 6 - enjoy the flight, but stay focused!
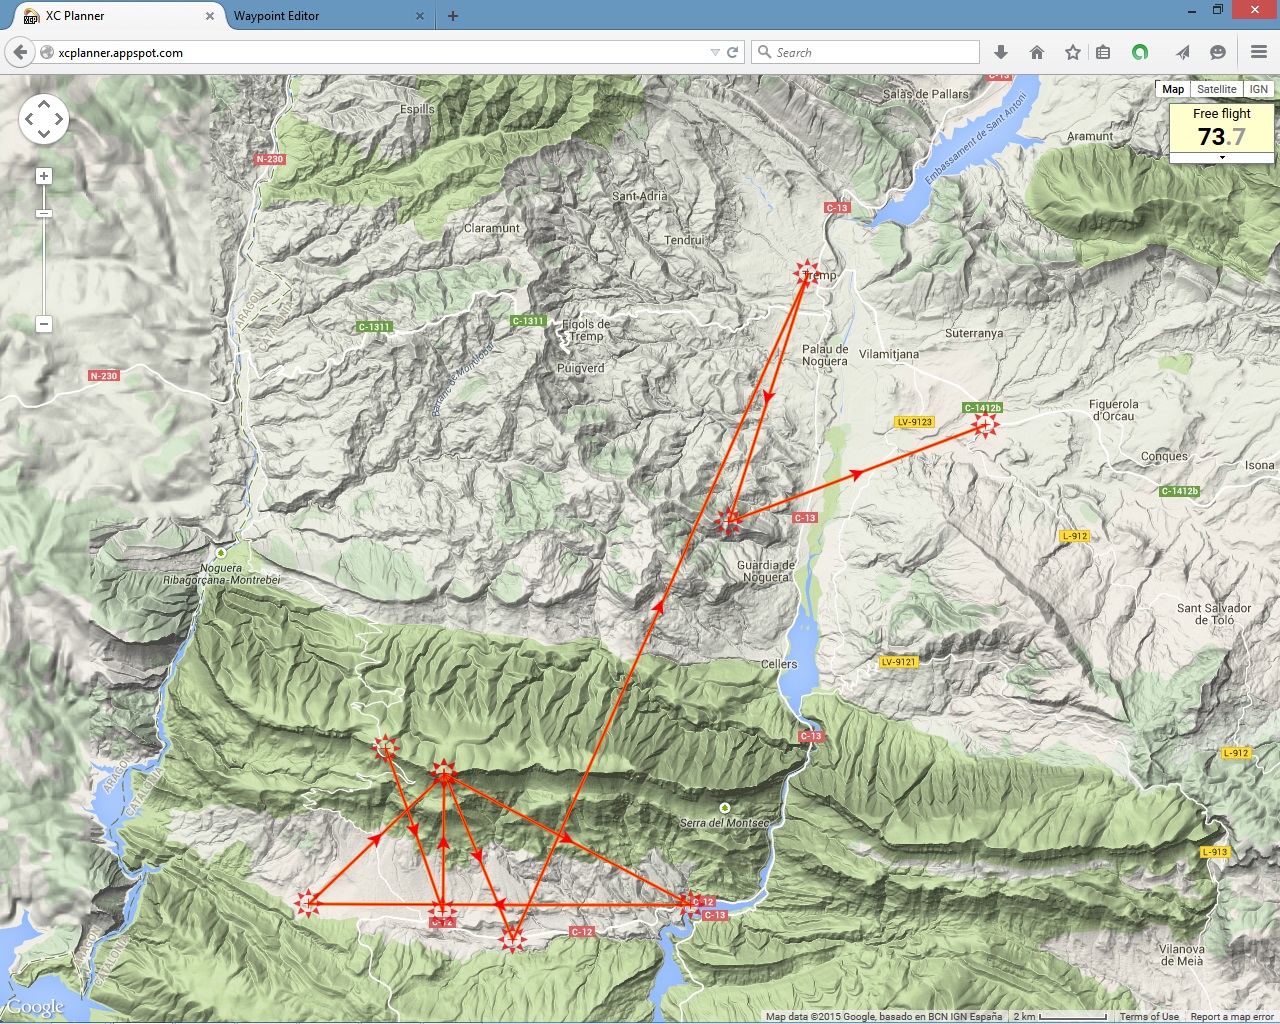
I had nothing to lose but also nothing to win, so decided to just have a nice day out. Everybody knew it would be the last into wind leg that would prove decisive and there were a bunch of different routes into this last turn from the previous turnpoint at Tremp. The winners arrived before the shade and I should've hung on where it was soarable. But after 7 days and 28 hours I wasn't really in the mood anymore and was happy to land out somewhere near the main road. It still took ages for the retrieve though and looking back at the track I realised how close I was to tagging that last turnpoint before goal and I kicked myself for not making just a little more effort.
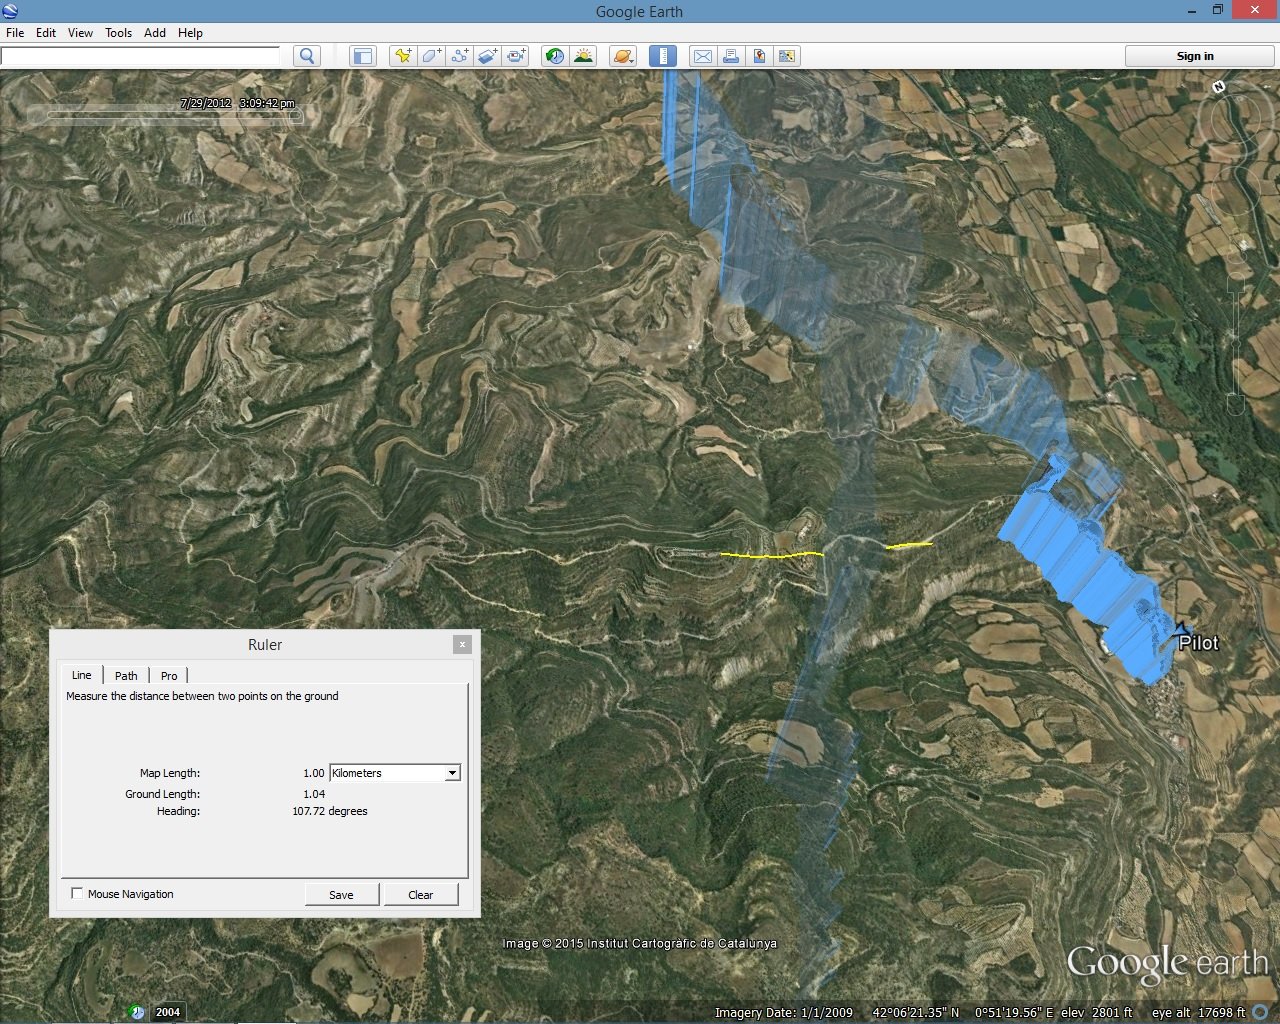
^ coulda / shoulda taken the turnpoint!
I only had 400m to the cylinder edge and then I could have soared waiting for the shade to pass... instead I bailed to land after a long flight and a long week. After the previous day's drilling, I wasn't in the chance-taking mood and just wanted to quit, go home and see the kids.
Later that night in the bar I realised how close I could've been to finishing better but two beers later I didn't feel so bad about it. I'd had a load of fun and made a bunch of friends. Thanks to the GPS review I was able to learn so much more.
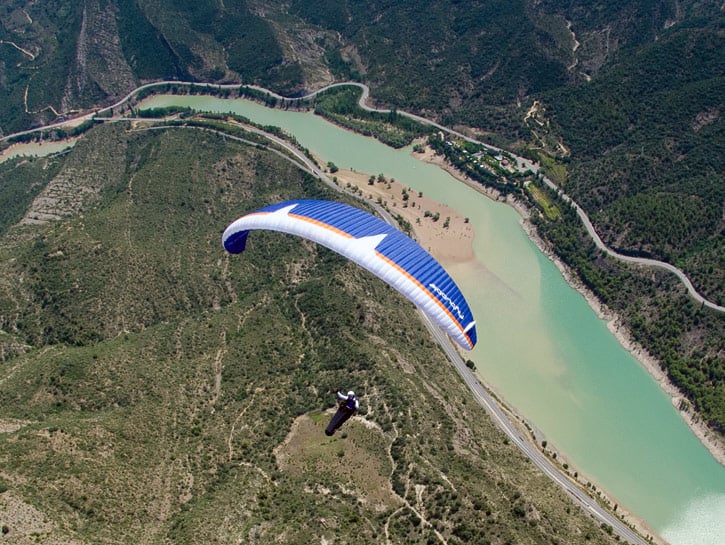
^ Phil Clark on glide. Pic © Marko Wramen
